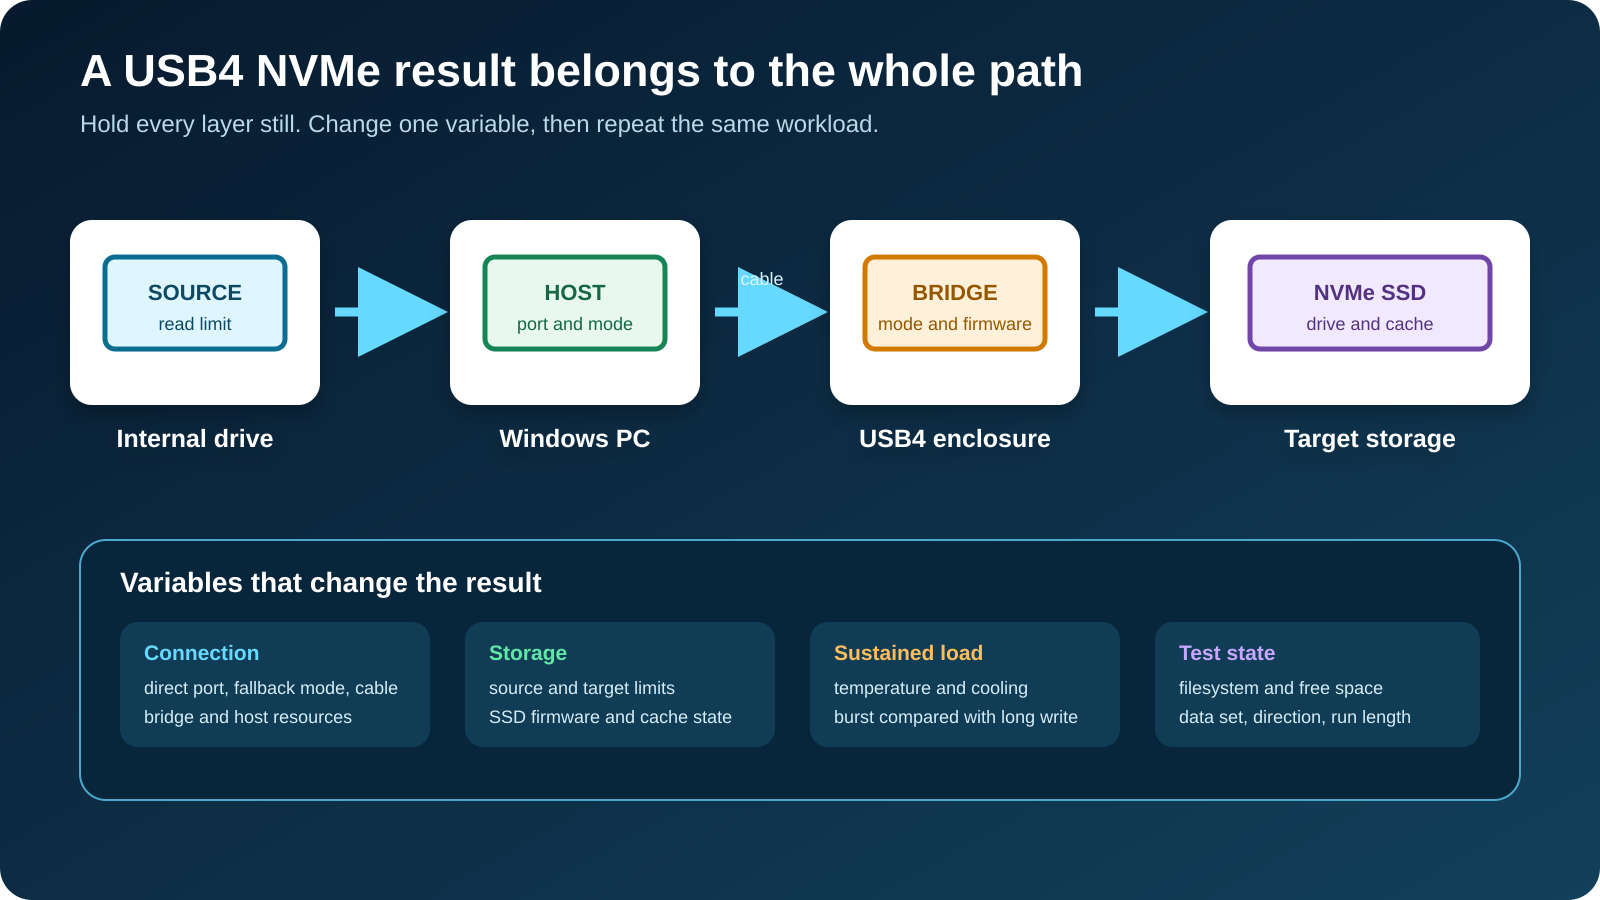
If your USB4 NVMe enclosure mounts in Windows but transfers are slower than expected, do not judge it from one copy or from the 40Gbps label. Your result is set by the slowest active part of the route: the source drive, the host port, the negotiated mode, the cable, the bridge controller, the NVMe SSD, cooling, cache state, the filesystem, or the workload.
Start with a baseline you can repeat, then change one item at a time. A test that changes the port, the cable, the file set, and the benchmark settings together cannot tell you which one mattered.
A 40Gbps label describes signaling capability, not the speed of your file copy.
Start here: match the pattern
| What you observe | What it suggests | Best next test |
|---|---|---|
| The same enclosure is much faster on another computer or port | The host port, negotiated mode, or host resources changed | Repeat the same test on each documented high-speed port |
| A short write is fast, then a long write drops and stays lower | The SSD cache, source drive, or heat may be limiting sustained work | Repeat one long write from a source proven faster than the target |
| Reads are healthy but writes are consistently low | The SSD write path, cache, free space, filesystem, or Windows policy needs attention | Record SSD model, free space, filesystem, and removal policy |
| Both reads and writes cluster near a slower connection class | The link may have fallen back, or an intermediate device may limit it | Connect directly with the enclosure’s documented high-speed cable |
| A folder of small files is far slower than one large file | The workload changed from sequential work to many file operations | Compare like with like rather than averaging the two |
| The first run is quick and later runs slow as the case heats | A thermal limit is possible | Log time and temperature, cool the same setup, then repeat |
| A benchmark looks fast but a real copy is slow | The two use different endpoints, data, queue depth, or cache state | Test the real workload and prove both endpoints |
The safe order for a slow enclosure
Each step narrows the next one, and none risks your data.
- Prove the source and target drives.
- Remove intermediate devices and prove the host port.
- Prove the cable.
- Check the exact bridge and SSD pairing.
- Test heat with a controlled load.
- Separate cache bursts from sustained writes.
- Control filesystem, free space, and Windows policy.
- Repeat one controlled test and read the result.
Do not start with a registry edit, a driver-cleanup utility, a blanket BIOS update, bridge firmware from a similar enclosure, or a reformat run as a speed experiment. A reformat destroys the volume and changes several variables at once, and none of the rest isolates a layer.
Do not disable security software to chase a number. Close storage-heavy work instead, and keep the same power source and Windows power mode between runs.
What 40Gbps does and does not tell you
USB-IF uses USB 40Gbps to describe a product’s signaling capability. It is not a promise that a file-copy window will show 5,000 MB/s. Protocol overhead, tunneled traffic, controller behavior, storage limits, and the workload all sit below that label.
The number also says nothing about the other storage endpoint. Copying from a slow internal SSD to a fast external one measures the source first, and copying from the enclosure to a nearly full or busy internal drive measures that destination. A synthetic benchmark avoids part of that problem by working on one drive, and it introduces its own data size, queue depth, cache, and timing choices.
For protocol background, read what USB4 is and the USB4 versus Thunderbolt 4 comparison. Your current mode still needs evidence from this setup.
Do not start from a target speed copied out of a review. OWC, StarTech, and other makers publish results for named hardware under stated conditions, and those figures are not a pass mark for a different host, SSD, bridge, cable, thermal state, and workload.
Build a baseline you can reproduce
Write the configuration down before running another test:
- computer model and the exact physical host port;
- whether the enclosure connects directly or through a dock, hub, adapter, or extension;
- cable maker, model or markings, and length;
- enclosure model, hardware revision, bridge controller if documented, and firmware version if the maker exposes one;
- installed NVMe SSD model, capacity, firmware, and usable free space;
- volume filesystem;
- source and target drive for file copies, with file set, total size, file count, and direction;
- benchmark version, data size, run count, and settings if you use one;
- whether the enclosure started cool or had just finished a long transfer.
Save the first result without interpreting it, and record both the peak and the stable rate during the long part of the transfer.
Step 1: prove the source and target drives
A file copy has a reader and a writer. Test both before blaming the enclosure.
For an external write, the internal source must read faster than the external target accepts data. For an external read, the internal destination must write faster than the enclosure supplies it. If either condition is unknown, a slow copy cannot isolate the enclosure.
Use the same large file for a first sequential check, then use your real project data when small-file performance matters. The two are not one workload.
If you have a second destination already proven fast, copy from the enclosure to it, then reverse direction:
- low external writes with healthier external reads point toward the target SSD write path, its cache state, free space, or write policy;
- low results in both directions on one host but not another point toward the host route;
- low results only when the internal drive takes part point toward that internal endpoint;
- a synthetic result that stays healthy while Explorer slows on one data set points toward workload or endpoint differences, not a broken USB4 link.
Do not use a USB flash drive as the comparison endpoint unless its sustained performance is high enough to matter. If what you want is a finished portable drive rather than an enclosure, diagnose this setup first, then compare portable SSD options.
Step 2: remove intermediate devices and prove the host port
Connect the enclosure directly to the computer. Remove the dock, monitor hub, KVM, front-panel extension, and passive adapter for this pass, and keep the same enclosure, SSD, cable, workload, and power state.
The direct test answers one question. Does the route improve once the intermediate device is gone? A yes means the removed path changed the available connection, resource allocation, or stability. It does not prove the dock is defective, so check its exact upstream and downstream port specifications before replacing it.
Then move the fixed direct setup between the computer’s documented high-speed ports. Do not assume two USB-C sockets share a controller or capabilities. Match each port to the computer maker’s manual, because a port marked only as USB-C may carry a slower data mode, charging, display output, or a combination.
Windows exposes its USB4 settings page only on supported OEM implementations, so its presence does not benchmark the enclosure and its absence does not prove a fault. The Windows USB version checks can gather clues, and a controller name is identification evidence rather than a throughput guarantee.
If one direct port is consistently faster, keep it as the control and check whether the slower port has a lower documented mode. Contact the computer maker when its specification and the observed state disagree.
Step 3: prove the cable
Use the cable supplied or explicitly required by the enclosure maker for the first direct pass. ASUS, OWC, and StarTech each tie their named USB4 enclosure claims to a suitable high-speed cable. A cable that charges the computer or runs a mouse has not proved a 40Gbps data path.
Stop using any cable with a loose, damaged, discolored, or unusually hot connector.
Then make one controlled substitution:
- Keep the same host port, enclosure, SSD, and test.
- Replace only the cable with a known-good cable documented for the required data capability.
- Repeat the same run from the same starting state.
- Restore the original cable once to confirm the result follows the cable.
Repeat both cables once, which helps separate a cable effect from cache, temperature, or background activity.
The USB-C cable speed test guide explains how to identify the data path without trusting connector shape. If the substitution proves the cable, choose a properly specified USB-C cable. A Thunderbolt 5 cable is relevant only when the devices and required mode justify it, because a higher label cannot upgrade a slower host or bridge.
Step 4: check the exact bridge and SSD pairing
The NVMe drive does not speak USB4 by itself. The enclosure contains a bridge that presents the storage path to the host, and its controller, firmware, and supported host modes all change the result.
Find the exact enclosure model and revision, then read its specification for:
- the bridge controller, if disclosed;
- USB4, Thunderbolt, and USB fallback modes;
- supported M.2 key, sizes, PCIe generation, and capacities;
- the required cable;
- operating-system and host requirements;
- the firmware update method for that exact model;
- the cooling assembly and thermal-pad placement.
StarTech’s 1USB4-NVME-ENCLOSURE is one exact example. Its datasheet names an ASMedia ASM2464PD bridge, USB4 and USB 10Gbps host compatibility, an included USB4 cable, and a thermal pad. None of that identifies the controller or fallback path in another product.
ASUS gives a second model-specific example. Its PA40SU support text says the full chain includes the host, interface, cable, bridge handshake, and SSD, and that some host combinations can fall to 10Gbps. A result near a slower connection class should therefore send you to the exact bridge and host documentation rather than to a universal Windows tweak.
Now confirm the drive. Record the exact SSD model and firmware, and check that the enclosure supports its M.2 key, length, capacity, and protocol. An M.2 card can be SATA or NVMe, and the shared shape does not make the protocols interchangeable, which is why the USB-C SATA enclosure guide covers a different storage path.
Read the SSD maker’s data sheet for sustained behavior, operating temperature, cache design if disclosed, and any heatsink requirement. Use its figures only within the maker’s stated test conditions, because an internal PCIe number is not what the same drive owes you through a USB4 bridge.
With power disconnected, check the installation:
- the SSD lies flat and is secured at the correct length;
- the thermal pad contacts the intended components;
- protective film was removed where the instructions require it;
- the pad thickness matches the exact enclosure instructions;
- the case closes without bending the SSD.
Do not peel an SSD label or improvise a thicker pad because the case feels warm, since the wrong pad can reduce contact or stress the board. If the result changes with a different supported SSD, it follows the SSD pairing, so check that drive’s firmware, health data, free space, and sustained-write documentation.
Step 5: test heat with a controlled load
Warm metal is not proof of throttling. A metal enclosure is supposed to move heat away from the controller and the SSD. Thermal throttling becomes a useful finding only when performance changes with time or temperature under a load you control.
Use this sequence:
- Let the enclosure return to a stable idle temperature.
- Keep the same host port, cable, source, target, file set, and power state.
- Start a transfer long enough to run past any short burst.
- Record the rate and elapsed time at regular points.
- Record temperature only through a maker-supported utility, and do not treat one number as a universal limit.
- Stop if the stated operating range is exceeded, the case becomes unsafe to touch, the drive disconnects, or you see or smell damage.
- Let the setup cool, then repeat once.
A repeatable decline followed by recovery after cooling supports a thermal branch. It does not tell you whether the SSD, the bridge, or the enclosure reaches its limit first.
Check airflow and assembly before buying anything. Do not cover vents, stand the enclosure on fabric, or remove a fan its design expects. ASUS and OWC describe cooling for their named products only.
Step 6: separate cache bursts from sustained writes
Some SSDs use a finite high-speed write area. Samsung’s TurboWrite paper gives an exact older example, where writes enter an SLC-like buffer and then move to the main storage area, so an uninterrupted write can fill the buffer and continue at a lower rate. Current drives use different cache designs and sizes, so the exact SSD manual controls.
Cache behavior can make three honest tests look contradictory:
- a small benchmark fits inside a fast cache and reports a high peak;
- a long sequential write leaves the cache and settles lower;
- an immediate repeat starts with less recovered cache or a warmer drive.
Do not average those outcomes into one “USB4 speed”. Label them as burst, sustained, and repeat-run behavior.
To test cache behavior, run the same large write after a consistent idle period and watch whether the rate changes at a repeatable transferred size or elapsed time. Compare the shape with the exact SSD maker’s documentation, and if the maker does not publish post-cache behavior, report the observed pattern without assigning a cause.
Keep the benchmark settings and the data set fixed, because synthetic data, a folder of small files, and one large media file do not exercise the same workload.
Step 7: control filesystem, free space, and Windows policy
Record whether the volume uses NTFS, exFAT, or another filesystem. Microsoft documents different feature support across Windows filesystems, and it does not promise that one format is always faster for an external NVMe workload.
Hold the test state still instead:
- compare results on the same filesystem;
- keep the same allocation and encryption state;
- record usable free space before each run;
- leave room for the full test data set and normal drive operation;
- delete test files only after you have preserved the result;
- allow a consistent idle interval before a repeated sustained-write test.
Free space is a test condition rather than a universal speed rule. A nearly full drive cannot accept the same test set and is not comparable with an empty review sample, so record the state rather than inventing a minimum percentage. Choose the filesystem for the systems and file sizes you actually use, and do not trade away a required feature to chase a benchmark.
Windows also exposes Quick removal and Better performance for external storage. Microsoft says Quick removal lets the device be disconnected without the Safely Remove Hardware process, while Better performance enables write caching and requires Safely Remove Hardware to protect data integrity. Check the current setting in that disk’s Device Manager Properties and Policies tab, and record it before changing anything.
Do not switch the policy only to raise a benchmark. If you choose Better performance for a documented workload, keep backups and use Safely Remove Hardware every time. If the policy is managed, ask the administrator rather than working around it.
Step 8: repeat one controlled test and read the result
You now have enough evidence for a clean comparison. Return to the baseline, change only the most likely variable, and run at least two passes in the same state. Record the stable part of a long transfer rather than its peak alone, and note any sharp transition, disconnect, error, or temperature change.
| Result after one controlled change | What you can conclude | Next action |
|---|---|---|
| The result follows one host port | The host route changes the outcome | Use the documented faster port and check the computer maker’s port support |
| The result follows one cable | The cable changes the outcome | Replace it with a cable documented for the required data mode |
| The result follows one SSD in the same enclosure | The SSD pairing changes the outcome | Check that SSD’s firmware, health, cache, and free space |
| Performance falls with time and recovers after cool-down | Temperature or sustained-load behavior is involved | Correct assembly and airflow, then ask the maker about thermal limits |
| A small test is fast but a long write settles lower | Burst and sustained behavior differ | Judge the drive against your real transfer length |
| Removing a dock or hub restores the result | The intermediate route changes the available path | Check its exact downstream mode and shared-resource limits |
| Every controlled route stays slow | The remaining common components need maker support | Send the recorded matrix to the enclosure, SSD, and computer makers |
Replacement becomes reasonable once the evidence shows fallback on compatible hosts, cooling that cannot hold your workload, or an unsupported SSD. Then use the USB4 NVMe enclosure owner, or compare Thunderbolt 5 external SSDs when your host and workload can use the added capability. New hardware will not fix a slow source drive or a small-file workload.
Frequently asked questions
Why does my USB4 enclosure look capped near a slower USB speed?
The route may have negotiated a fallback mode, and the number alone cannot prove it. Connect directly, use the maker’s documented cable, test each documented host port, and check the exact host and bridge specifications with the SSD and workload fixed.
Is 40Gbps equal to 5,000 MB/s in Windows?
No. USB-IF uses 40Gbps as signaling language. File-copy throughput carries protocol and controller overhead and is limited by both storage endpoints, the bridge, the SSD, cache, thermal state, and workload.
Why is the first part of a copy fast and the rest slow?
The source or target may have a finite write cache, the device may warm under sustained work, or another endpoint may become the limit. Repeat the same long transfer from a cool idle state, then compare the shape with the exact SSD and enclosure documentation.
Should I turn on Better performance in Windows?
Only if you understand the tradeoff and have a workload reason. Microsoft says Better performance uses write caching and requires Safely Remove Hardware, so changing it without changing your removal habit puts data at risk.
Does a hot aluminum case mean the SSD is throttling?
Not by itself, because the case may be carrying heat away as designed. A thermal finding needs a repeatable decline under the same sustained load and recovery after cooling.
Should I format the enclosure as NTFS to make it faster?
Do not format a working drive as a first speed test. Formatting can erase data and changes the filesystem state. Choose a filesystem for the compatibility and features you need, then leave it fixed while you compare.
Sources and methodology
This guide was built from current official documentation retrieved on July 28, 2026. USB-IF controls USB data-performance labels. Microsoft controls Windows USB4 visibility, filesystem features, and external-storage removal policy. Exact StarTech, ASUS, OWC, and Samsung documents are used only for the named controller, enclosure, cooling, cable, benchmark, or cache examples.
No hardware was tested for this article, and no universal expected speed is asserted. The procedure treats each result as evidence about a complete path and changes one variable at a time. Vendor benchmark numbers are not used as pass or fail thresholds.


![[All Fixes] Discord Voice Connection Issues – No Route/RTC/ICE](https://thunderboltlaptop.com/wp-content/uploads/2020/10/All-Fixes-Discord-Voice-Connection-Issues-–-No-Route_RTC_ICE-380x250.png)