Wireshark is the most widely used network packet sniffer and analyzer, an essential tool in the arsenal of every information security expert and penetration tester. It captures packets over the network and presents them in as much detail as possible.
It is used by network and systems administrators to troubleshoot issues (e.g., determining who or what is using available bandwidth), by security engineers to analyze security problems (e.g., identifying possible attacks or malicious activities), QA engineers use it to verify network applications (e.g., finding unsecured or bloated applications), developers to debug protocol implementations and also more generally people use it to learn network protocol internals.
Wireshark captures live streaming packet data from a network interfaces on the fly, supporting a very wide range of protocols (e.g., HTTP, XMPP, SIP, BitTorrent, Bitcoin, most everything over TCP and UDP, etc.) and displays them with very detailed protocol information. It can filter and search for packets on many various criteria, colorize packet display based on filters and create various kinds of statistics from the data captured. It can also import and export files from other similar capture programs and capture traffic from a range of different network media types (Ethernet, WiFi, Bluetooth, and even VoIP and GSM). Here, it is important for one to have at least some basic understanding of the OSI ( Open Systems Interconnection) model of the layers involved in networking communications and translations (from physical to datalink, network and transport layers involved).
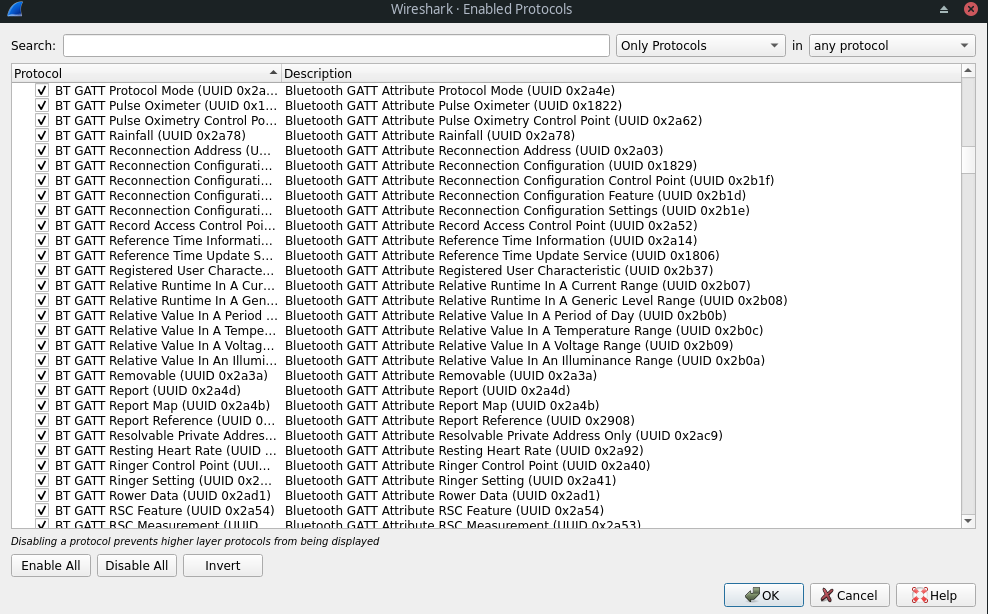
Wireshark also comes with protocol dissectors for a very wide range of protocols. A dissector is basically a translator between the flowing raw data across the wire and Wireshark itself. Each supported protocol must have a dissector built into it and Wireshark uses several dissectors at the same time in interpreting each packet, determining which dissector to use by following programmed logic and making well-educated guesses. However, it does not always make the right choices when selecting dissectors, particularly in cases where the protocol uses non-standard configuration (e.g., non-default ports, usually configured so by systems administrators for security purposes). In such cases, forced decode is performed (right-click on packet for the purpose), manually selecting the dissectors to be used.
Table of Contents
Installing Wireshark
Wireshark is usually readily available in the repositories of most Linux distributions and installed via their corresponding package manager.
For example, in Debian-based Linux distributions (such as Ubuntu):
sudo apt-get install wireshark
Fedora:
sudo yum install wireshark
Archlinux:
sudo pacman -S wireshark
One should also make sure to install the other necessary tools alongside Wireshark, like dumpcap (in case they don’t ship by default). There’s a command-line version (tshark), as well as GUI versions (available with either GTK2 or Qt front-end).
Kali Linux is a Debian-based distribution designed and customized for digital forensics and penetration testing which includes Wireshark by default in its toolkit of applications and scripts available, configured and pre-built by default.
Set Up Wireshark for Capture Traffic
Wireshark needs to be run with sufficient privileges that allow for capture. For that purpose, Wireshark implements privilege separation where the GUI (or tshark in CLI) runs as a regular user, while the dumpcap capture tool runs as root. Set up network privileges for dumpcap so:
chown root /usr/sbin/dumpcap
chmod u+s /usr/sbin/dumpcap
In case there is an error indicating dumpcap isn’t in /usr/sbin, replace it with /usr/bin.
Before setting dumpcap’s network privileges, create a group wireshark and add yourself to it:
sudo groupadd -s wireshark
sudo gpasswd -a $USER wireshark
Then re-login in order to apply the group changes (or use newgrp wireshark as regular user to enter the wireshark group). Run the groups command after that to make sure you are part of the wireshark group. Then run sudo chgrp wireshark /usr/sbin/dumpcap to change the group of dumpcap to that of wireshark, followed by sudo chmod o-rx /usr/sbin/dumpcap.
Alternatively, one can just run sudo wireshark, but that is usually not recommended in most cases besides experimenting and getting to know Wireshark at first.
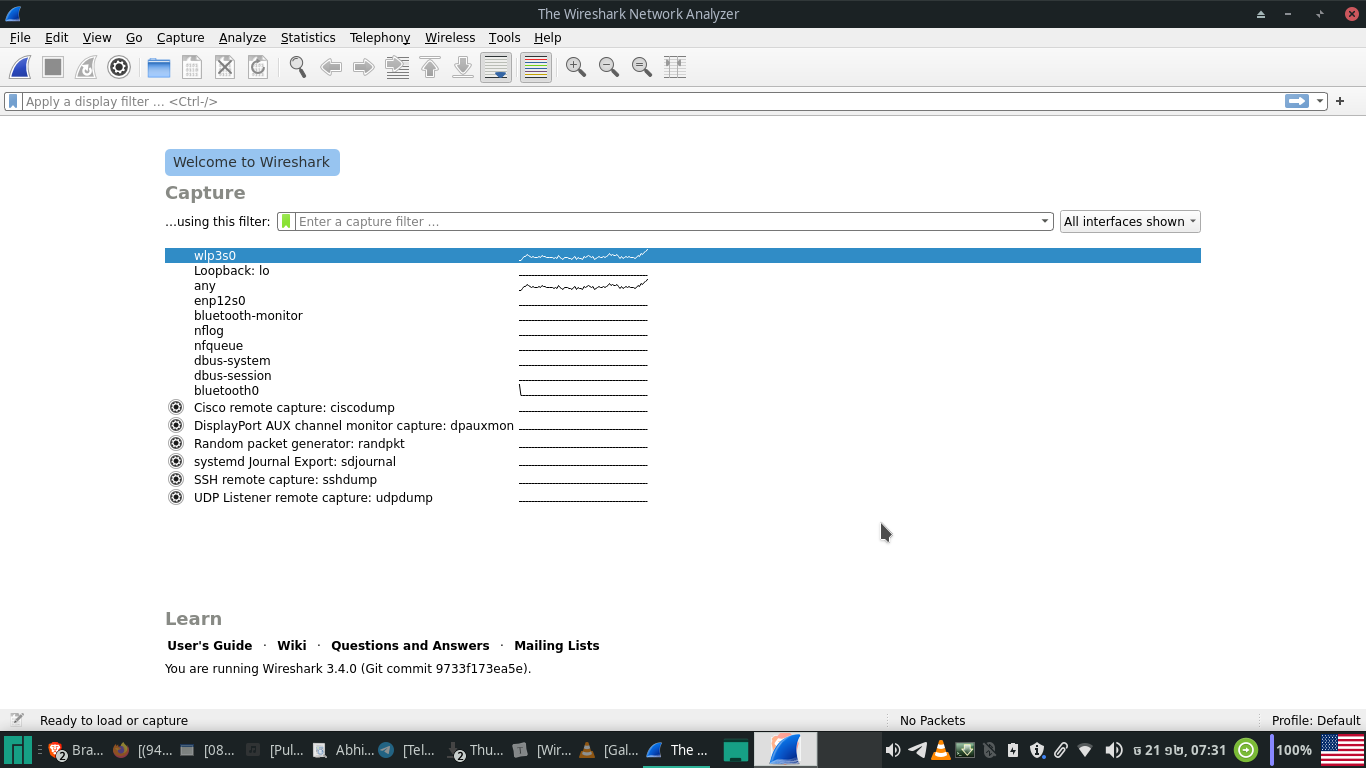
After all of the above is configured, set up traffic to capture to and from your local machine – capturing your own traffic is the easiest way to successfully capture packet streams at first. The traffic to and from your own machine is obviously independent of network topology, so one needn’t worry about that in this case. So, choose the interface to capture from to begin the process and make sure you’re capturing both incoming and outgoing traffic.
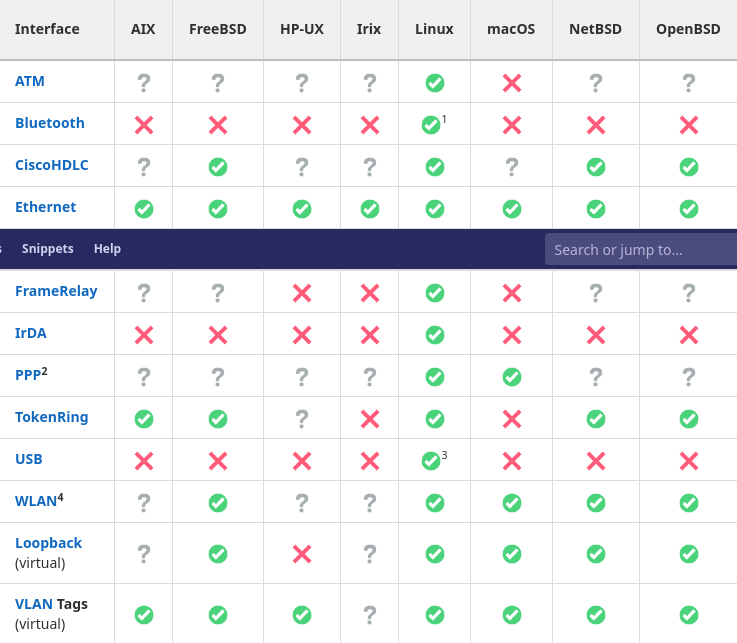
The libraries and underlying capture mechanisms Wireshark utilizes make use of the libcap and WinPcap libraries, sharing the same limitations they do. Below is a short list of what Wireshark supports on what platforms.
Promiscuous Mode
The network interface is set to promiscuous mode by default when Wireshark is run and has to be explicitly disabled to run otherwise (unless the network interface does not support promiscuous mode). Promiscuous mode turns on a regime of reception for network topology devices which does not filter incoming packets by MAC, but receives and accepts all incoming network data. It is commonly used to sniff out all network traffic for the purpose of helping diagnose network issues, but it can also be used to look up for any unencrypted plaintext data, including user names and passwords from FTP, Telnet or HTTP (look at example below for sniffing Facebook messenger traffic in plain text). In networks composed of switches however (as opposed to hubs), promiscuous mode is useless for surveillance.
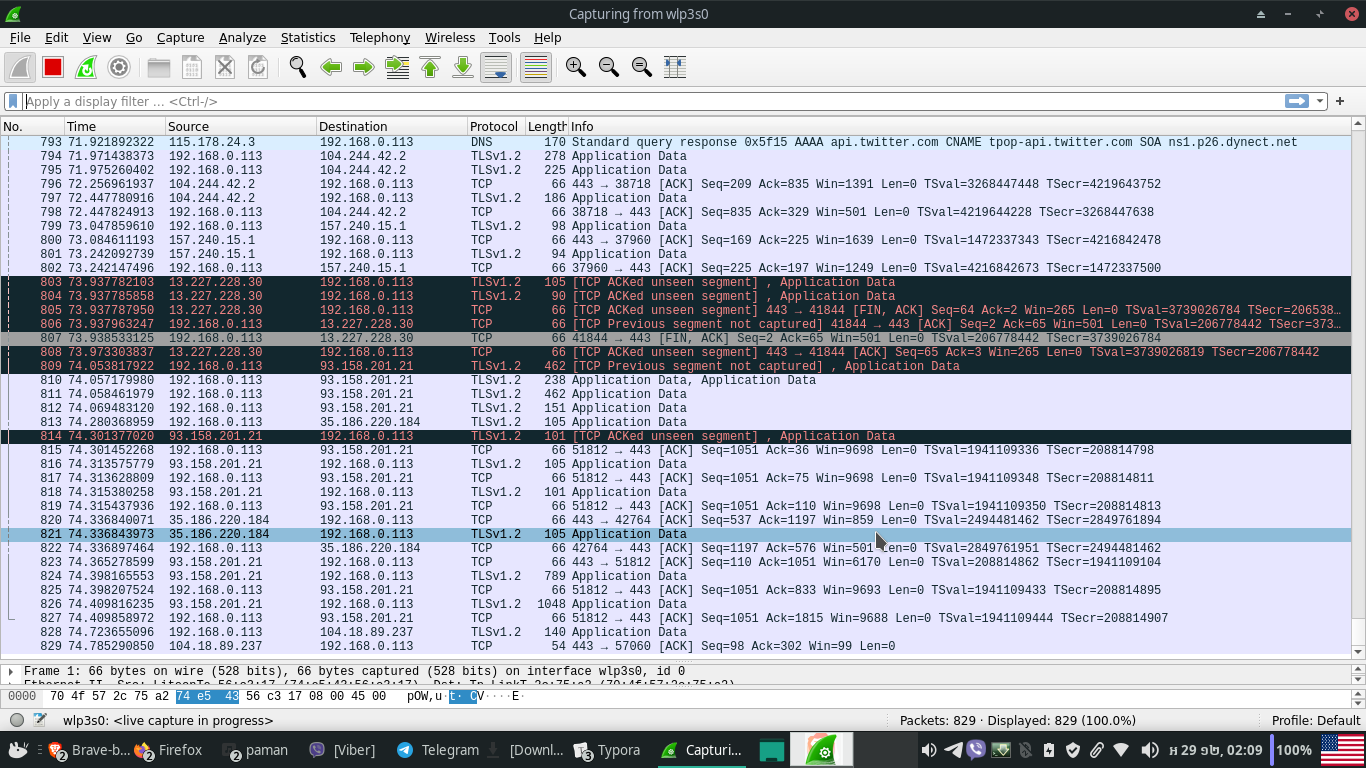
Capture Packets
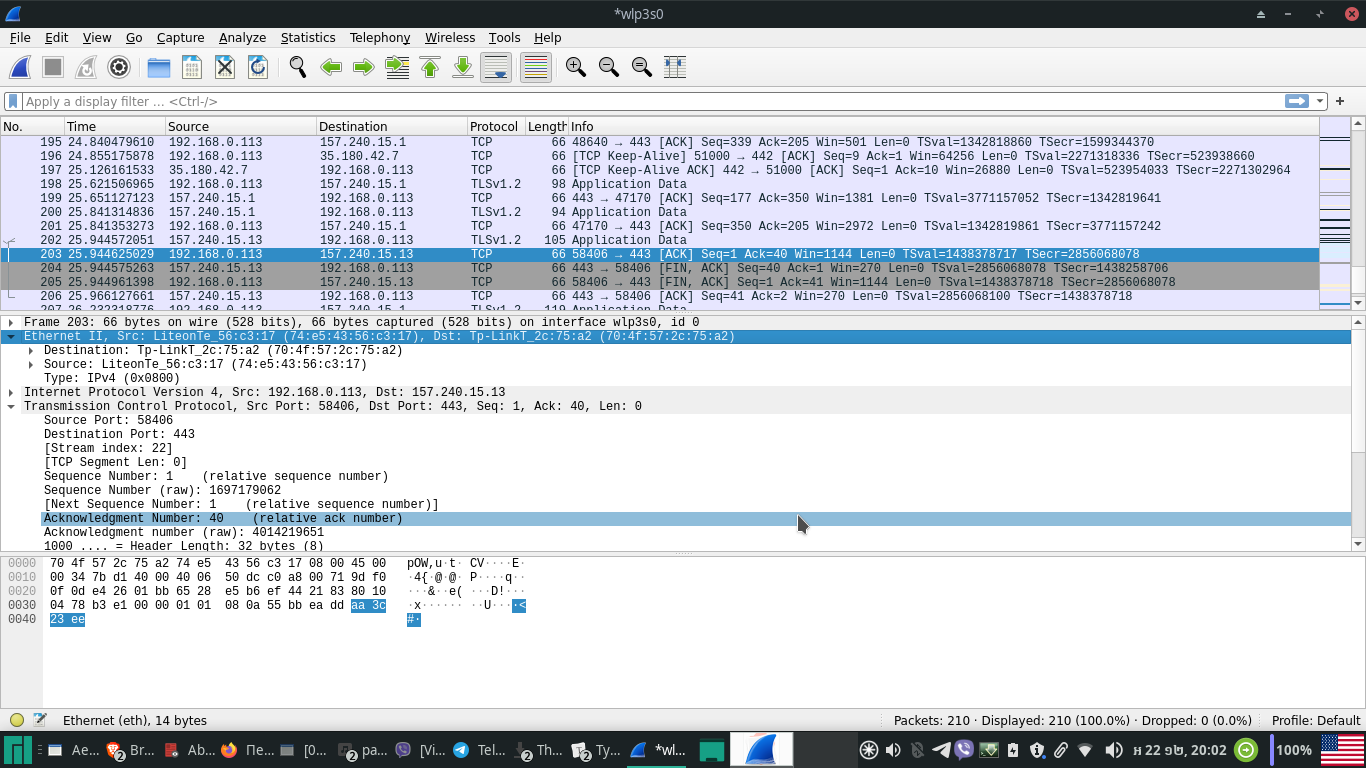
As Wireshark starts capturing streams of packets, it presents us with three separate panels. Each row in the first (capture) panel represents a single data packet while each column represents additional information about it.
No. (col 1) – indicates the packet sequence number
Time (col 2) – the timestamp of when the packet is captured
Source (col 3) – shows the source IP or device from which the packet is coming
Destination (col 4) of where it is going to.
Protocol (col 5)- represent the protocol type of the packet captured
Length (col 6) – its length size
Info (col 7) – additional quick information about the packet.
Below that is the packet details panel which reveals more detailed information about a packet selected from the capture panel above – its various different parameters in a tree structure which can be expanded and collapsed.
And lastly at the bottom the packet bytes panel represents the information of the packet details panel as the byte sequence of its flow. The first column displays the data offset, the one next to it – the data in hexadecimal values, and the last one – the ASCII representation of it.
Capture and Analyze Facebook Traffic and IP addresses
As an example, we capture the packets that constitute the messages sent from our Facebook account to another in a file and then open the file. First we need to get Facebook’s IP by opening up a terminal and doing:
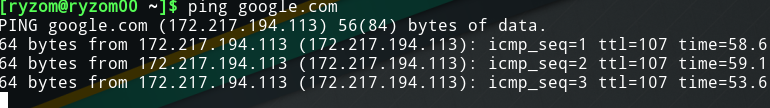
Then we filter Facebook traffic using the filter in the capture screen above (typing in: ip.addr == 172.217.194.113, as shown in the screenshot below).
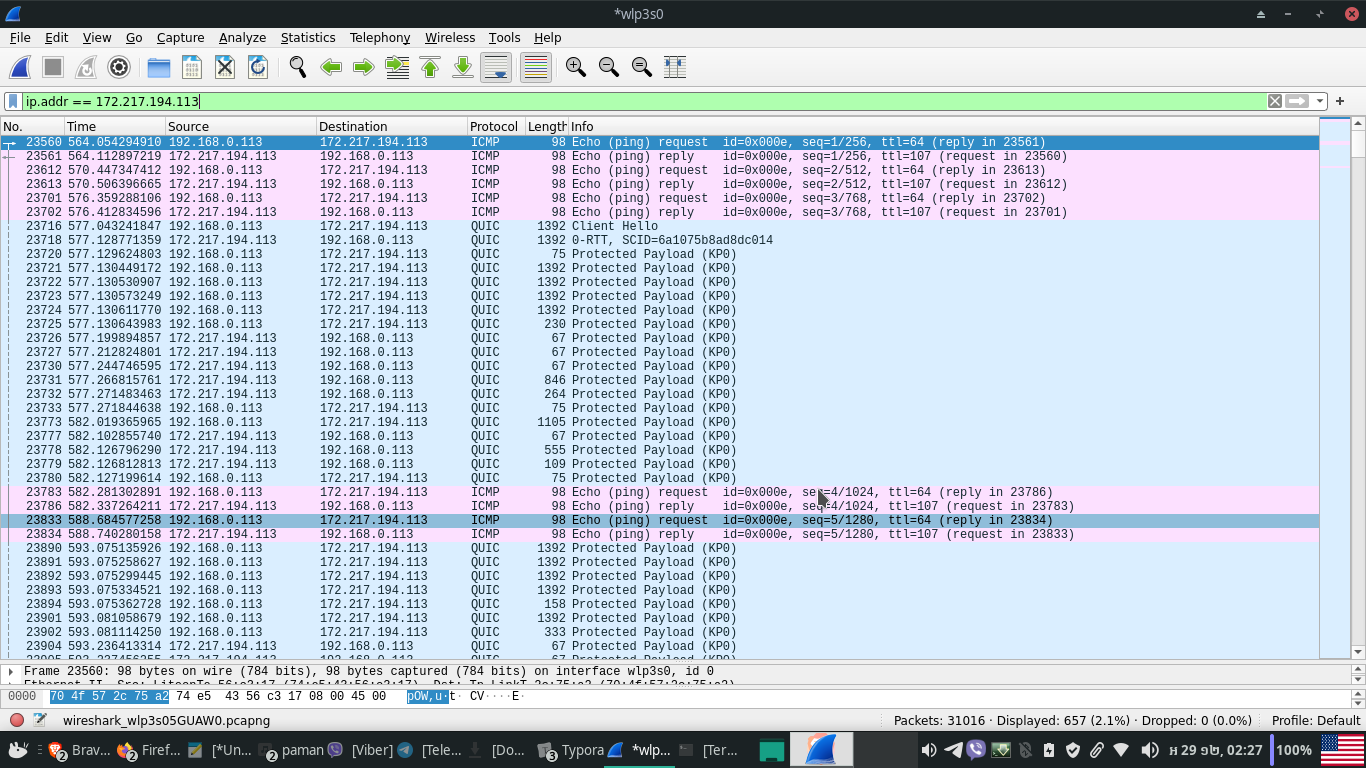
Therefrom you can right-click on any packet and follow end-to-end to find the IPs of information exchanged back and forth. However, since most social networking media introduced SSL/TLS (after the release of a tool called FireSheep), the traffic of messages between users is no longer in plaintext and difficult to crack.
Wireless Traffic Capture and Packet Analysis
The wireless spectrum is normally divided into operational channels that refer to some portion of the radio spectrum. While in the US there are only 11 channels allowed, other countries allow for even more.
The importance of this is to do with the fact that just as a wireless local area network (WLAN) can operate only on one channel at a time, so correspondingly Wireshark must be set to capture traffic on that same channel (keep in mind that traffic from channels next to each other may sometimes overflow from one to the other).
Before starting Wireshark sniffing wireless traffic, the wireless interface must be put in monitor mode (also known as RFMON mode). Under monitor mode our wireless client stops transmission and receiving of data, only listening to the packets flying through the air (make sure your WiFi network interface controller supports monitor mode). To switch to monitor mode, use iwconfig from the command-line to check which is your wireless interface.
$ iwconfig
lo        no wireless extensions.

enp12s0   no wireless extensions.

wlp3s0    IEEE 802.11 ESSID:"Dora"
          Mode:Managed Frequency:2.457 GHz Access Point: 70:4F:57:2C:75:A2

          Retry short limit:7 RTS thr:off Fragment thr:off
          Power Management:off
In this case, it is wlp3s0. To change the interface into monitor mode regime, root privileges are required, (either sudo or su to switch to root). To get wlp3s0 to run in monitor mode and is operational, type and execute the following:
iwconfig wlp3s0 mode monitor
iwconfig wlp3s0 up
Lastly, change the channel targeted for listening to (in this case, 4):
iwconfig wlp3s0 channel 4
After having completed the above adjustments, launch Wireshark and start capturing.
The main difference between wireless and wired packets is the 802.11 header at layer 2 which contains information about the packet and the medium on which it is transmitted.
There are three types of 802.11 packets:
Management packet – used to establish the connection between layer 2 hosts (subtypes including authentication, association and beacon packets). A beacon type packet is one of the most informative packets one can capture. It is broadcast from a wireless access point across a channel to notify any listening clients of its availability and the parameters they must adjust themselves to in order to connect to it.
Control packets – that allow for the delivery of management and data packets while managing congestion
Data packets – carrying the actual data.
The main concern when deploying and administering a wireless network is the security aspects of the data transmitted across it. With data flying over the air, free to capture by anyone who knows how, it is crucial that the data be encrypted. Otherwise, anyone equipped with Wireshark and an AirPcap-enabled card can see it.
Capture Traffic Using a Remote Machine
In this case, you can use Wireshark running on a remote machine in combination with some remote control software like VNC or Windows Remote Desktop, otherwise remote capturing is limited to UNIX pipes and using the WinPcapRemote feature.
Following (TCP) Streams
While capturing streaming data through the network, there may be a whole lot of different services, web sites and instances of network activities going on, so it may be tedious to try tracking data streams and packets that belong to some particular session or stream.
Which is why Wireshark provides a Follow TCP Stream option which allows you to see the complete stream that belongs to a single session, service or site. Which is found by right-clicking on the packet in the capture panel (Follow > TCP) and once selected, it applies a filter rule which isolates only those packets that belong to that stream (can also be applied to UDP and SSL).
Setting up filters
Filters serve a very important role in packet capture since often we’d like to monitor only a particular protocol or service without the overhead of the entire traffic streaming.
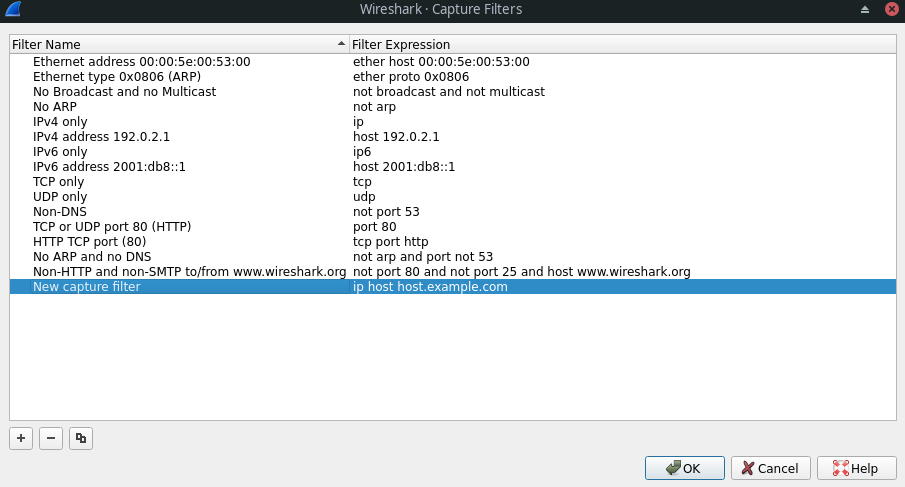
Filters can be applied as capture filters and display filters. The quickest and most basic way to apply a filter is by typing it into the filter box at the top of the capture window interface (e.g., dns) and clicking Apply (or pressing Enter). Otherwise, for more advanced filtering operations one should go to the Capture menu and Capture Filter, as applied for selectively monitoring and filtering out specific packet or packets as assigned. The general syntax for writing filtering rules looks like this:
<Protocol name><Direction><Host(s)><Value><Logical operations><Expressions>
For example, to capture TCP packets with source port 443, the rule is written as:
tcp src port 443
Similarly, to drop ARP packets (Address Resolution Protocol, used to map MAC addresses into IPs) we just type in not arp.
The display filter option (Analyze > Display Filters) is then used to select specific packets from the already captured file containing the already captured packets. Display filter rules also follow a fixed structure:
<Protocol> . <String 1> . <String 2> . <Comparison Operator><Value><Logical operators><Expressions>
For example, to see all TCP packets captured on port 80, we write the following rule:
tcp.port==80
Or, for dropping all ARP packets: !arp. Or, to list packets from only a particular IP: ip.addr==193.168.52.101
Name Resolution
Name resolution is the process of converting one identifying address into another, more user friendly name, for better understanding.
To set how addresses resolve go to the Capture Menu > Options and then click on the Options tab, as shown in the screenshot below.
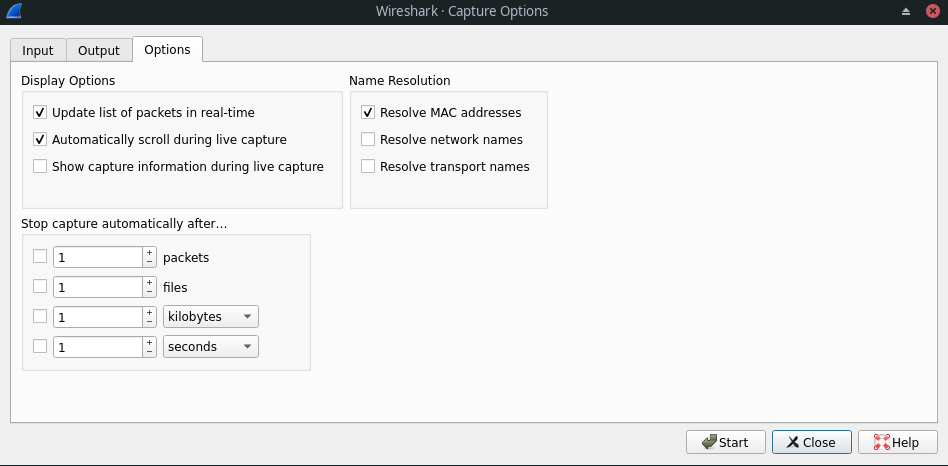
The MAC name resolution makes use of the ARP/RARP protocol to translate physical (MAC) addresses to its corresponding logical IP address, while network name resolution further converts the IP address into its corresponding DNS name (e.g., 216.58.195.142 becomes google.com). Lastly, the transport name resolution identifies services according to their port numbers (e.g., port 80 hosts an http service).
Statistics of Captures
The Statistics menu of Wireshark provides a set of statistical features for generating an overview of network activity.
I/O Graph
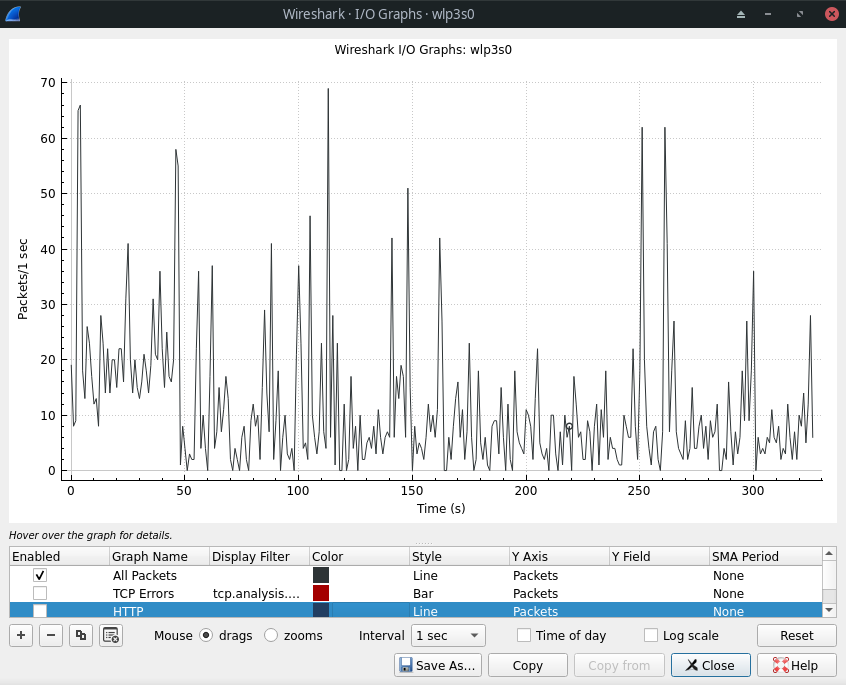
To generate a graphical view of a captured file, go to the Statistics menu and choose IO Graph. Graphs representing different protocols and packets can be added and colored to easily differentiate them (choosing the type of packet in the Y Axis column and time interval from the SMA Period column).
Summary
The Summary option returns a quick report about the entire capture process by reflecting key points such as interface, capture duration, and number and size of packets captured, essentially displaying all the basic information in a nutshell.
The Summary option is very useful during network forensics whenever a quick overview of network activity is required.
Protocol Hierarchy
Protocol Hierarchy organizes the statistical information of the different protocols seen during network analysis in a nodal form, arranging them according to their layers in the OSI hierarchy and representing them in percentage form of the total traffic captured.
Conversations
The Conversational statistical analysis method visualizes the information about end-to-end communications between two different IPs and is most useful when applied for analysis that has to be carried out between host/client and server.
Conclusion
Wireshark has always ranked in the top 10 network security tools with its simple, yet intuitive and powerful interface that makes it easy to learn and work with, making it an essential asset in the toolkit of every penetration tester and network security professional.